During weeks 5-7, I have learned alot of information as it relates to information technology. One of the sections i found the most interesting was the project we did on excel. I took Computer problem solving my sophomore year in college and learned a lot of the basics about excel software. Although much of the information was similar, this course went into greater depth about the breathe and depth of excel. I was completely unaware of the variety as well as amount of information Microsoft excel could process.
As stated before I did an internship this past summer, and we depended on Excel to help process and organize a lot of our data. When I think back, I remember a partner making reference to pivot tables. At that point in time, i though a pivot table was just a chart with a lot of formulas. I had no Idea, that in a pivot table you could organize and format data, to produce output in a variety of forms.
Below is an example of Raw data
Some of the more complex this I learned were
- IF Functions: Where you type in the "logical test", then the value if true (words must be in "quotations"), and then the value if false

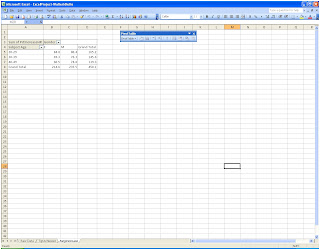
Pivot Tables: Select the data that you would like to organize, including the headings. once the information is selected, you have the options to import the table into the current sheet or into a new worksheet.You then have the option to organize the information in a variety of ways. By select different heading you can calculate "sums", "avg", etc.
Other capabilities that MS Excel has is that it can organize output data in a visual format. When presenting to clients and upper level management, it is sometimes more effective to use a chart or graph to explain the trends in data. This allows the user to start with a very high level anaylsis, and then lead into greater details. Below is an exmaple of what a bar chart looks like.
A variety of charts and graphs can be chosen from the tool bar above.
Overall my interest with excel has definitely grown through this course.
I not only enjoyed learning about excel, but all different types of of software programs, and the legal parameters surround software.
Overall, I enjoyed completing the web 2.0 presentation project. I have created numerous presentations in Microsoft PowerPoint presentations, but I had a great time dded a unique element to overall assignment. I was unaware of the variety of web presentation tools that were available. I learned how to import audio, pictures, and music into a single presentation file. I also learned how to incorporate some creative effects into the presentation- transitions.
This class is going great, and I can not wait for whats next!


No comments:
Post a Comment